Follow the blog posts:
For Android:
For iOS:
Bruce Ng's software development blog
An archive of solutions of programming problems I have faced in my career
Follow the blog posts:
For Android:
For iOS:
While working to my our product work with mobile devices, I encountered this issue with Chrome for Android.
It seems that setting an element height to 100vh will include the height of the Chrome Address bar and tabs. This is designed so that when user scrolls down the address bar and tabs will go away to show the web page using the whole screen(except the notification shade, of course).
Where as in Chrome for desktop, 100vh only includes the height of the viewing area below the address bar.
Because of this feature, website that looks correctly in desktop may not work correctly in mobile, need to keep this in mind. Use Android Chrome remote debugging feature to debug the website in Chrome for Android.
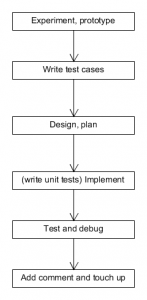
Recently I have found that I could have been more efficient than how I was doing, my approach of diving straight into the code to implement the feature and then keep refining later works, but takes quite some time.
The problem is, every time I make a change, I have to test to make sure it doesn’t break anything, this caused me to test multiple times as I experimented to make my solution work. I have found that it would save more time if I do all the implementation first, then test.
It would save more time if I write down a list of test cases and mark each as done after I have tested. So I won’t forget what I have tested and can be sure that those cases work.
Also, if possible, write unit tests so tests can be executed automatically quickly in place of manual testing.
So I came up with the following flow, maybe it will be faster.

If you find that you need to debug code in solution A while running project B. You can build the required assembly in Debug mode and copy both the DLL and .pdb files to project B and build B.
Then when debugging in Visual Studio, you can step into code of solution A
It’s possible to trace back to the code that triggered an Ajax call from the Network tab of the Chrome Developer Tools.
From the network tab, simply check the initiator column of the request list, by hovering the mouse over it the stack trace that lead to that request will be displayed.
Use some of the suggestions below:
The power of communication is often underestimated, try to talk to the author(s) of the code first.
Then, read through design documents provided by the authors. However stop if the documents seem to make things more confusing than help you understand.
Make use of note and diagramming tools, such as the SQL Server diagram tool, to make understanding the code more intuitive.
Learning the framework or development style used (MVC, N-tier, REST api) can be very useful to understand how code work if it follows certain programming style.
Do a debug and step through the code, see how things connect with each other. Don’t abuse this method ’cause it can be time consuming.
Hack around to get the job done.
Follow the stackoverflow answer in this link:
It seems the masterpage needs to be included in the project.
The masterpages under /_catalogs/masterpage are publishing masterpages, they are stored in the Content DB. It seems for application pages the server only searches for masterpages under the _layouts folder.